| 1995 |
Q4 |
Toy Story |
Animation |
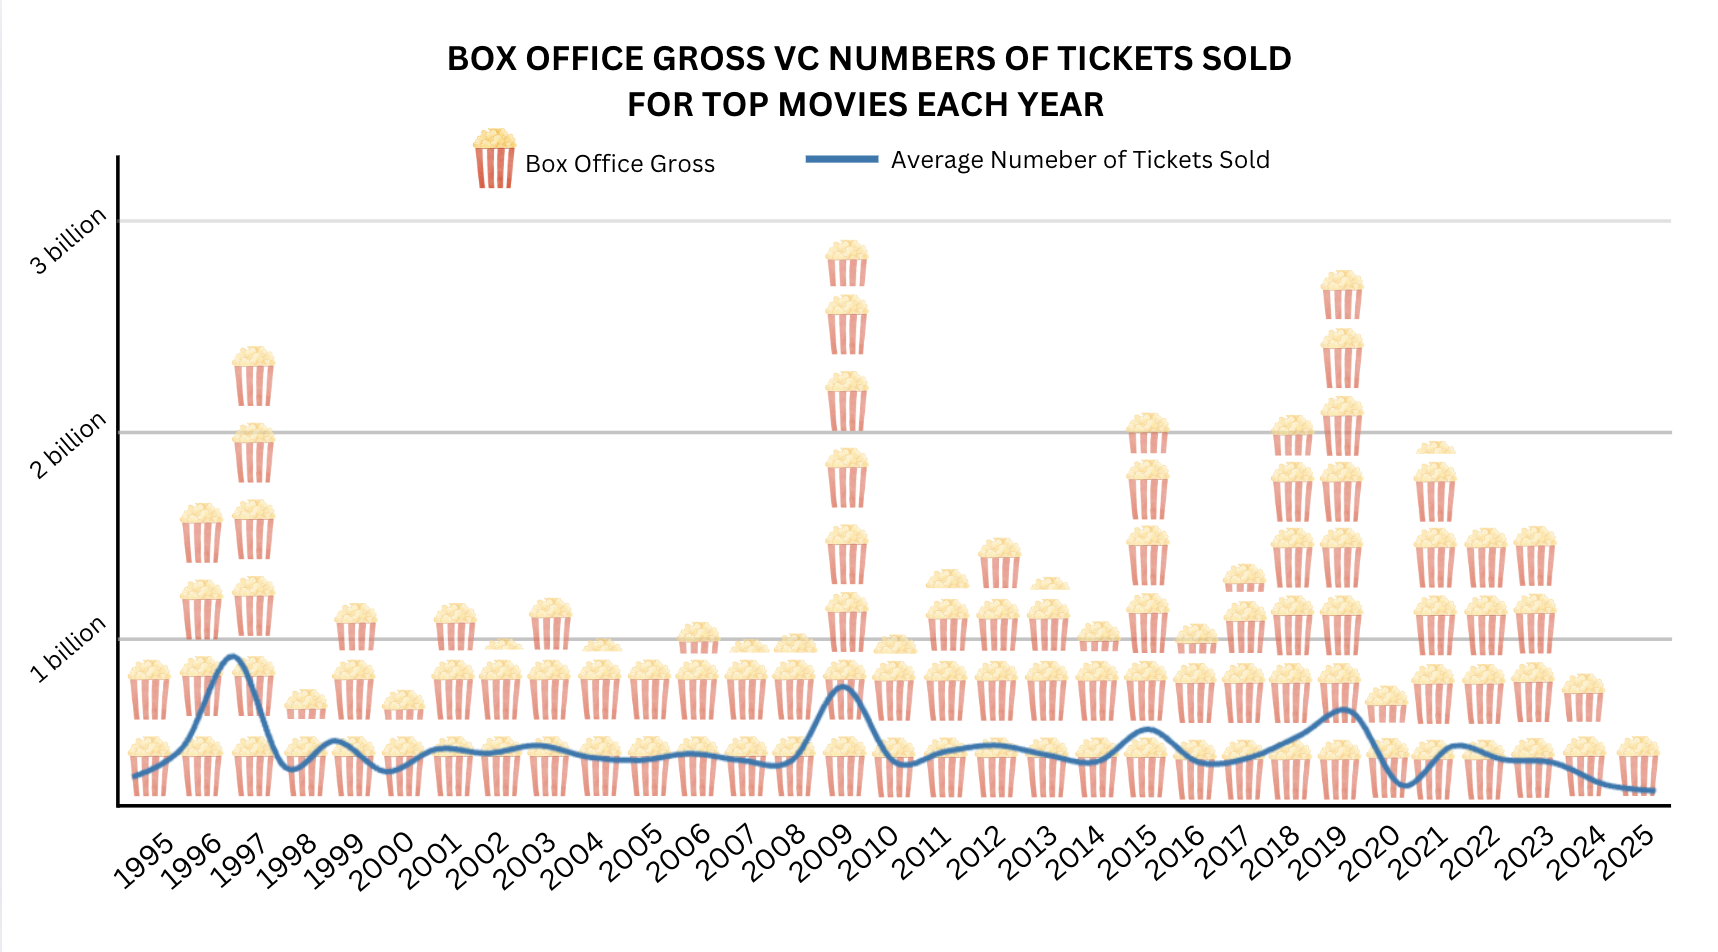
$363,007,140.00 |
$29,140,617.00 |
12.46 |
$4.35 |
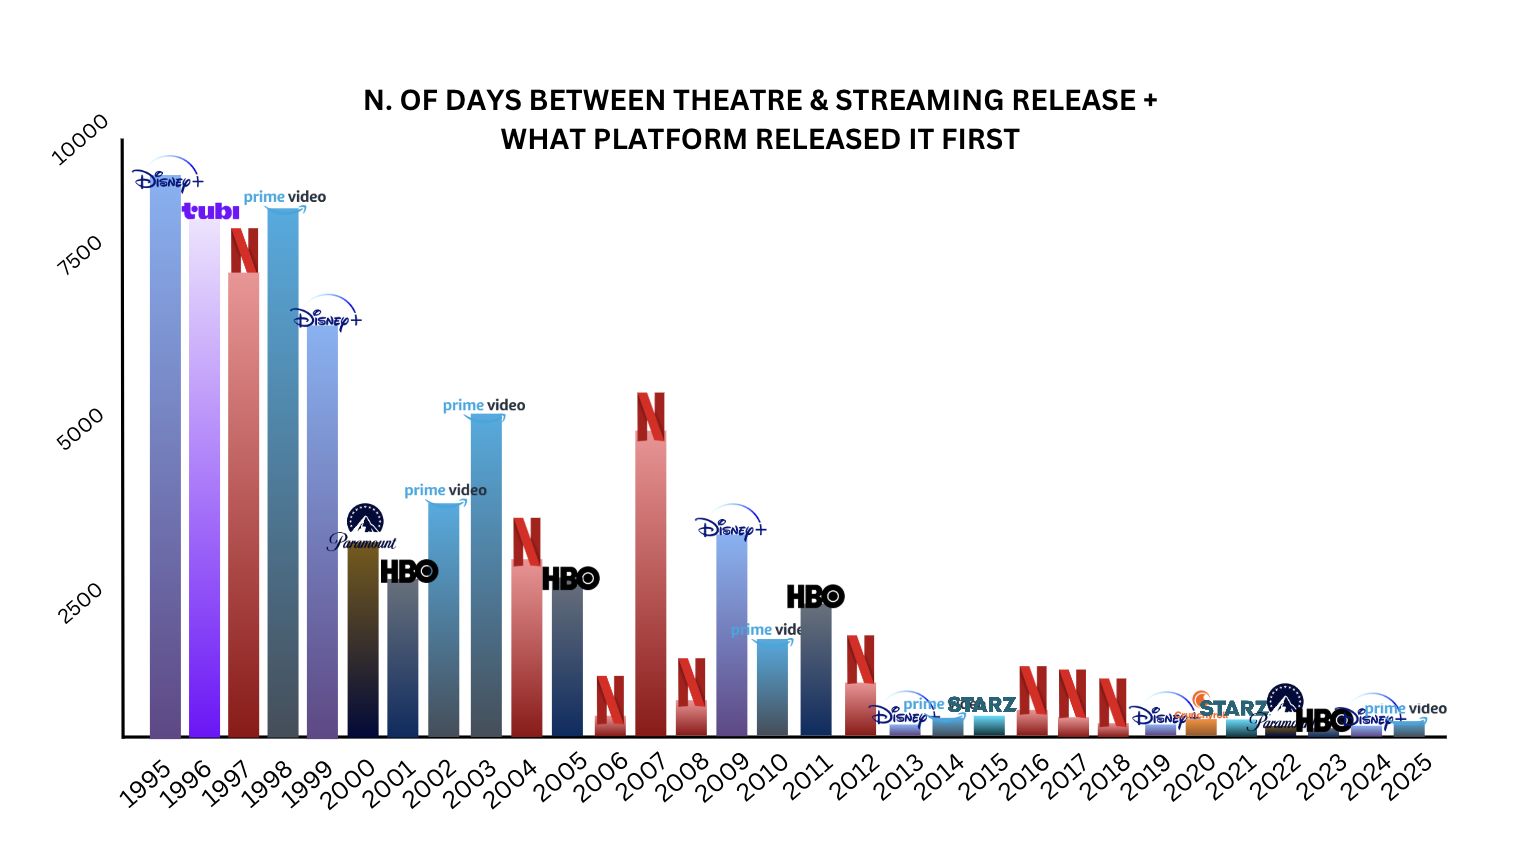
Disney+ |
10 |
165.00% |
11/12/2019 |
11/22/1995 |
8756 |
| 1996 |
Q3 |
Independence Day |
Sci-Fi |
$817,400,891.00 |
$50,228,264.00 |
16.27 |
$4.42 |
Tubi |
78 |
24.36% |
1/1/2025 |
7/3/1996 |
10409 |
| 1997 |
Q4 |
Titanic |
Drama/Romance |
$2,257,844,554.00 |
$28,772,088.00 |
78.47 |
$4.59 |
Netflix |
238 |
9.18% |
7/1/2023 |
12/19/1997 |
9325 |
| 1998 |
Q3 |
Aramageddon |
Sci-Fi/Action |
$553,709,788.00 |
$36,089,972.00 |
15.34 |
$4.69 |
Amazon Prime |
162 |
8.23% |
9/1/2021 |
6/30/1998 |
8464 |
| 1999 |
Q2 |
Star Wars: Episode I - The Phantom Menace |
Sci-Fi/Fantasy |
$1,046,515,409.00 |
$66,450,964.00 |
15.75 |
$5.08 |
Disney+ |
10 |
165.00% |
11/12/2019 |
5/19/1999 |
7482 |
| 2000 |
Q2 |
Mission: Impossible 2 |
Action/Thriller |
$546,388,108.00 |
$57,845,297.00 |
9.45 |
$5.39 |
Paramount+ |
68 |
14.81% |
2/12/2024 |
5/24/2000 |
8664 |
| 2001 |
Q4 |
Harry Potter and the Sorcerer's Stone |
Fantasy |
$1,009,046,830.00 |
$115,557,827.00 |
8.73 |
$5.66 |
HBO Max |
33 |
81.52% |
5/27/2020 |
11/16/2001 |
6767 |
| 2002 |
Q4 |
The Lord of the Rings: The Two Towers |
Fantasy/Adventure |
$948,945,489.00 |
$96,752,619.00 |
9.81 |
$5.81 |
Amazon Prime |
4 |
25.00% |
3/24/2011 |
12/5/2002 |
3031 |
| 2003 |
Q4 |
The Lord of the Rings: The Return of the King |
Fantasy/Adventure |
$1,147,997,407.00 |
$133,457,863.00 |
8.60 |
$6.03 |
Amazon Prime |
4 |
25.00% |
3/24/2011 |
12/3/2003 |
2668 |
| 2004 |
Q2 |
Shrek 2 |
Animation/Comedy |
$932,530,034.00 |
$151,327,036.00 |
6.16 |
$6.21 |
Netflix |
53 |
18.10% |
11/25/2014 |
5/19/2004 |
3842 |
| 2005 |
Q4 |
Harry Potter and the Goblet of Fire |
Fantasy |
$896,346,413.00 |
$206,180,957.00 |
4.35 |
$6.41 |
HBO Max |
33 |
81.52% |
5/27/2020 |
11/18/2005 |
5304 |
| 2006 |
Q3 |
Pirates of the Caribbean: Dead Man's Chest |
Adventure/Fantasy |
$1,066,179,747.00 |
$254,478,081.00 |
4.19 |
$6.55 |
Netflix |
44 |
22.11% |
1/1/2014 |
7/7/2006 |
2735 |
| 2007 |
Q2 |
Pirates of the Caribbean: At World's End |
Adventure/Fantasy |
$960,996,492.00 |
$343,972,864.00 |
2.79 |
$6.88 |
Netflix |
44 |
22.11% |
1/1/2014 |
5/25/2007 |
2413 |
| 2008 |
Q3 |
The Dark Knight |
Superhero/Action |
$1,007,336,937.00 |
$270,831,354.00 |
3.72 |
$7.18 |
Netflix |
9 |
9.57% |
12/9/2008 |
7/18/2008 |
144 |
| 2009 |
Q4 |
Avatar |
Sci-Fi/Fantasy |
$2,923,706,026.00 |
$279,736,515.00 |
10.45 |
$7.50 |
Disney+ |
146 |
2.40% |
8/17/2023 |
12/18/2009 |
4990 |
| 2010 |
Q2 |
Toy Story 3 |
Animation/Family |
$1,066,970,811.00 |
$218,080,958.00 |
4.89 |
$7.89 |
Amazon Prime |
4 |
25.00% |
3/24/2011 |
6/18/2010 |
279 |
| 2011 |
Q3 |
Harry Potter and the Deathly Hallows - Part 2 |
Fantasy |
$1,342,139,727.00 |
$483,189,427.00 |
2.78 |
$7.93 |
HBO Max |
33 |
81.52% |
5/27/2020 |
7/15/2011 |
3239 |
| 2012 |
Q2 |
The Avengers |
Superhero/Action |
$1,518,815,515.00 |
$392,538,708.00 |
3.87 |
$7.96 |
Netflix |
83 |
7.11% |
6/1/2016 |
5/4/2012 |
1489 |
| 2013 |
Q4 |
Frozen |
Animation/Musical |
$1,290,000,000.00 |
$86,880,969.00 |
14.85 |
$8.13 |
Disney+ |
10 |
165.00% |
11/12/2019 |
11/27/2013 |
2176 |
| 2014 |
Q2 |
Transformers: Age of Extinction |
Sci-Fi/Action |
$1,104,054,072.00 |
$302,138,390.00 |
3.65 |
$8.17 |
Amazon Prime |
63 |
3.17% |
6/13/2016 |
6/27/2014 |
717 |
| 2015 |
Q4 |
Star Wars: The Force Awakens |
Sci-Fi/Fantasy |
$2,068,223,624.00 |
$528,966,675.00 |
3.91 |
$8.43 |
Starz |
24 |
2.08% |
4/1/2016 |
12/18/2015 |
105 |
| 2016 |
Q2 |
Captain America: Civil War |
Superhero/Action |
$1,153,337,496.00 |
$379,539,142.00 |
3.04 |
$8.65 |
Netflix |
89 |
5.51% |
12/25/2016 |
5/6/2016 |
233 |
| 2017 |
Q4 |
Star Wars: The Last Jedi |
Sci-Fi/Fantasy |
$1,332,539,889.00 |
$450,821,889.00 |
2.96 |
$8.97 |
Netflix |
124 |
11.99% |
6/18/2018 |
12/15/2017 |
185 |
| 2018 |
Q2 |
Avengers: Infinity War |
Superhero/Action |
$2,048,359,754.00 |
$640,521,291.00 |
3.20 |
$9.11 |
Netflix |
139 |
8.83% |
12/25/2018 |
4/27/2018 |
242 |
| 2019 |
Q2 |
Avengers: Endgame |
Superhero/Action |
$2,797,501,328.00 |
$1,223,641,414.00 |
2.29 |
$9.16 |
Disney+ |
10 |
165.00% |
11/12/2019 |
4/26/2019 |
200 |
| 2020 |
Q4 |
Demon Slayer: Kimetsu no Yaiba - The Movie: Mugen Train |
Animation/Action |
$507,127,293.00 |
$61,316,248.00 |
8.27 |
$9.18 |
Crunchyroll |
4 |
25.00% |
6/22/2021 |
4/23/2021 |
60 |
| 2021 |
Q4 |
Spider-Man: No Way Home |
Superhero/Action |
$1,910,982,770.00 |
$600,506,041.00 |
3.18 |
$10.17 |
Starz |
25 |
51.84% |
5/22/2022 |
12/17/2021 |
156 |
| 2022 |
Q2 |
Top Gun: Maverick |
Action |
$1,495,696,292.00 |
$241,222,421.00 |
6.20 |
$10.53 |
Paramount+ |
56 |
7.33% |
12/22/2022 |
5/27/2022 |
209 |
| 2023 |
Q3 |
Barbie |
Comedy/Fantasy |
$1,436,000,000.00 |
$356,322,044.00 |
4.03 |
$10.94 |
HBO Max |
96 |
14.82% |
12/15/2023 |
7/21/2023 |
147 |
| 2024 |
Q4 |
Inside Out 2 |
Animation/Family |
$652,900,000.00 |
$295,000,000.00 |
2.21 |
$11.31 |
Disney+ |
159 |
-21.00% |
9/25/2024 |
7/14/2024 |
73 |
| 2025 |
Q1 |
Captain America: Brave New World |
Superhero/Action |
$413,127,647.00 |
$169,782,715.00 |
2.43 |
$11.31 |
Amazon Prime |
167 |
0.00% |
4/15/2025 |
2/14/2025 |
60 |